
Microphones: Comb Filtering 1
In this and the following two instalments of his on-going series about microphones, Greg Simmons explains the causes of comb filtering, how it affects our captured sounds, what we can do to avoid it, and what we can’t do to fix it.
In the previous instalment we looked at frequency response – what it is and how it is specified for microphones. No discussion of microphones and frequency response would be complete without mentioning comb filtering – a common problem that can make a mockery of a microphone’s frequency response and ruin the captured sound. Let’s discuss comb filtering now because it’s going to be mentioned in the forthcoming instalments about polar response and off-axis response, and it’ll be convenient to have a detailed explanation to refer back to.
CAUSE & EFFECT
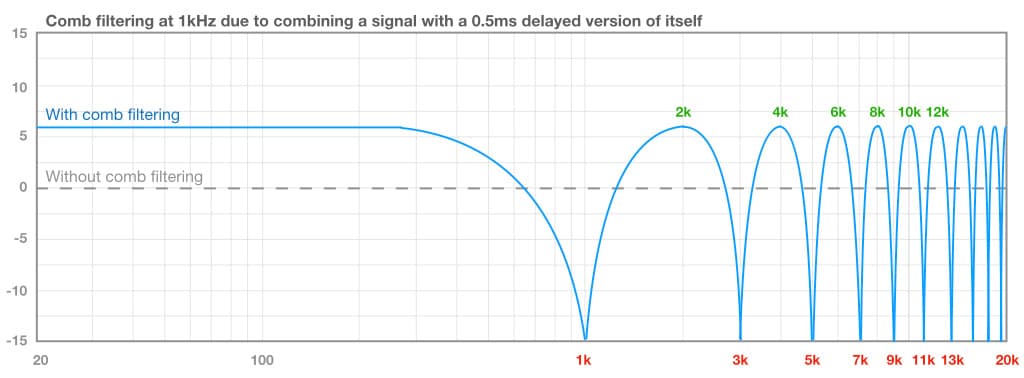
Comb filtering, or combing, occurs whenever a sound is combined with a delayed version of itself, and produces a series of harmonically-related peaks and dips throughout the frequency response. If the delay time is short enough – somewhere between 25ms (0.025s) and 25us (0.000025s) – those harmonically-related peaks and dips will occur somewhere within the audible bandwidth (20Hz to 20kHz), and they’re going to be a problem if they occur at frequencies that exist within the captured sound. They collectively create an unwanted effect that sounds similar to phasing or flanging, but without the modulation and feedback.
They collectively create an unwanted effect that sounds similar to phasing or flanging, but without the modulation and feedback.
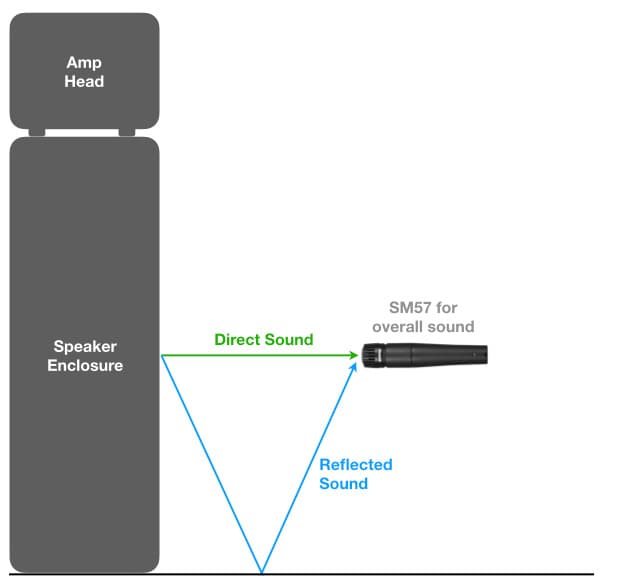
Comb filtering can occur when a microphone captures an additional version of the sound source, typically one that has reflected off a nearby surface. The reflected sound travels a longer distance to the microphone than the direct sound, which means it arrives some time after the direct sound and therefore becomes a delayed version of it. When both versions of the sound are combined at the microphone’s diaphragm, comb filtering occurs.
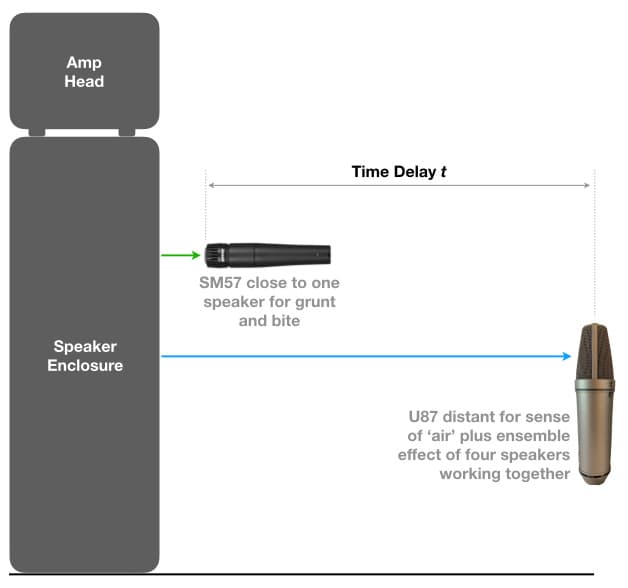
Comb filtering can also occur when two or more mics are used to capture the same sound from different distances, as shown below. The sound arrives at the further microphone a short time after it arrives at the closer microphone, creating a delayed version of the sound. Each mic’s signal might sound good on its own, but adding both together creates the characteristic comb filtering effect – resulting in a bad sound and a perplexing problem for the novice. Surely two good sounds added together should create an even better sound!
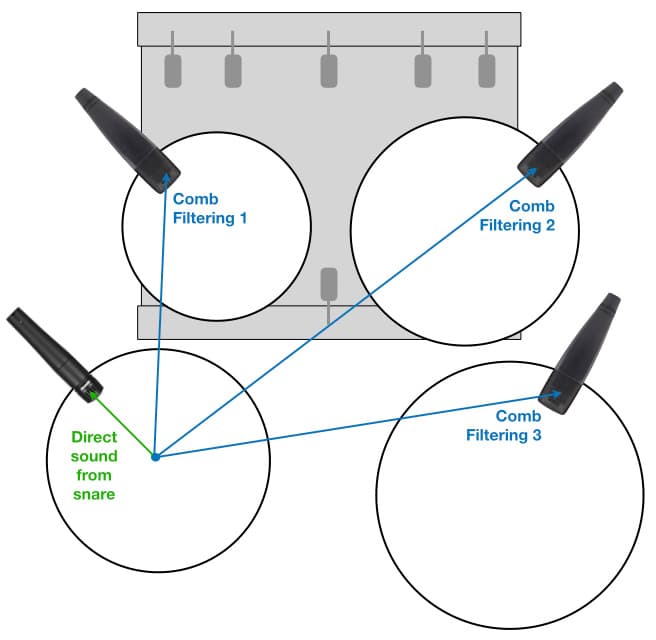
The example above uses just two mics. Consider a close-miked drum kit, a situation that typically results in four or more mics all placed within a radius of a meter or so from the snare. Every mic will be capturing some spill from the snare. The snare might sound great through its own microphone(s), but as each other mic is added to complete the drum mix it introduces its own unique comb filtering with the snare – reducing the snare’s impact and clarity. When solo’d or PFL’d the snare sounds focused and punchy, but in the mix with the other mics it becomes blurred and spongy.
We’ll discuss these problems and their solutions in the next instalments. For now, we need to understand how and why comb filtering occurs, and that means diving in to some fundamental audio theory. Grab your SCUBA gear and weights, because we’re about to dive deep…
WHAT IS SOUND?
Musicians and sound engineers use two different languages to describe what something sounds like. One is the subjective language that attempts to describe intangible things (such as sound, which we can’t see, touch, taste or smell) by borrowing words from our more tangible senses, particularly sight and touch. For example “This guitar sounds too bright”, “That bass isn’t fat enough” or “The snare sounds blurred and spongy…” The other is the objective language that refers to the definable and measurable aspects of sound, and brings with it eye-glazing terms like Hz, dB, wavelength, polarity and phase. Sound engineers have to be fluent in both the subjective and objective languages when discussing sound, because musicians use the subjective language to describe what they’re hearing but audio equipment uses the objective language to describe what it’s doing. So we must translate the musicians’ subjective language through the objective language of our audio equipment to achieve the desired result.
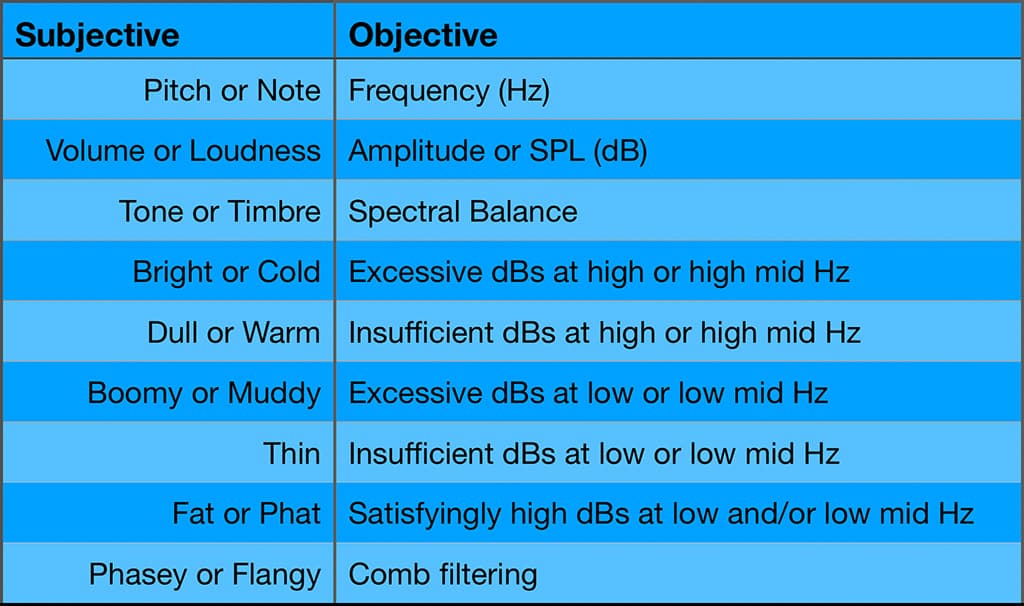
In this and the following instalment we’ll be focusing on the objective aspects of sound – the measurable and definable things – with the goals of understanding what causes comb filtering, how to recognise it when you hear it, and how to prevent it. Let’s delve into those eye-glazing terms…
GOOD VIBRATIONS
From an objective point of view, sound is created by vibrations. If something is vibrating strongly enough and at the right speed (i.e. between 20 and 20,000 vibrations per second), there’s a good chance that we’ll perceive those vibrations as ‘sound’. If those vibrations are repeating at a consistent rate it means they exhibit periodic motion – which, in turn, means they can hold a note and are therefore good for musical applications. Let’s take a closer look at those musically good vibrations by studying something at the heart of many musical instruments…
The Vibrating String
The illustration below shows a string suspended between two points. The string will have a certain length and a certain mass (i.e. weight), and it will be held under a certain amount of tension. Collectively, the combination of the string’s length, mass and tension will determine how fast it vibrates, which determines the note it plays. Faster vibrations mean higher notes, and slower vibrations mean lower notes.
The contemporary grand piano has 88 notes, covering just over seven octaves. Conceptually, each of those 88 notes has its own string, and each of those 88 strings uses a different combination of length, mass and tension to determine how fast it vibrates – which determines its note. Longer and heavier strings are used for lower notes, while shorter and lighter strings are used for higher notes. That’s the concept: 88 strings for 88 notes. In reality there are over 200 strings in a contemporary grand piano. The lowest bass notes use a single long and heavy string, but the other notes use multiples of shorter and lighter strings playing together to increase the volume and richness of their sound.
In comparison to the grand piano, the acoustic guitar has only six strings and they are all the same length. However, each string has a different thickness and weight to give it a different mass, which gives it a different note. We adjust each string’s tuning by altering the tension with the tuning pegs. We change the note of any given string by pressing the string onto the fretboard, which changes the length of the vibrating section of the string – as we already know, a shorter length means a higher note. The acoustic guitar uses a combination of mass and player-adjustable length to deliver over three octaves of notes from just six strings, and uses tension to adjust the fine-tuning of each string.
The illustration below reduces every string instrument to its most basic element: a string held under tension between two mounting points. In this example the string is stationary, otherwise known as being in its state of rest. It is not vibrating and therefore it is not creating any sound.
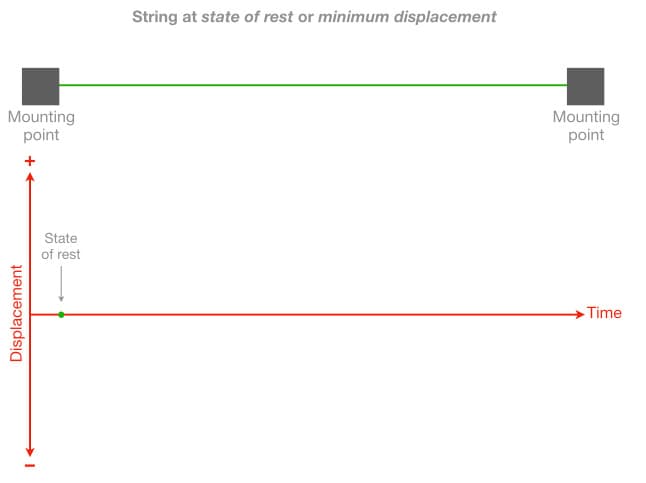
If we place our finger on the centre of the string, pull it down and hold it in place, we are transferring energy into the string. As long as we hold the string in place with our finger, the energy is being stored in our finger and in the string. Something interesting happens when we let go of the string…
Like many things in physics, the string is fundamentally lazy and simply wants to return to its state of rest. However, to do that it must first use up – or dissipate – the energy we’ve just put into it. And so it vibrates up and down until the stored energy is dissipated through a combination of kinetic energy (movement) and thermal energy (heat). When all of the energy is dissipated, the string will be back at its state of rest.
The illustrations below track the movement at the centre of the string as it goes through the vibration process. The graph’s vertical axis represents how far the centre of the string has moved away from — or has been displaced from – its state of rest, hence it is called displacement. For these examples, upwards displacement is considered a positive value (+) and downwards displacement is considered a negative (-) value. We will consider the state of rest as the point of minimum displacement, represented as zero.
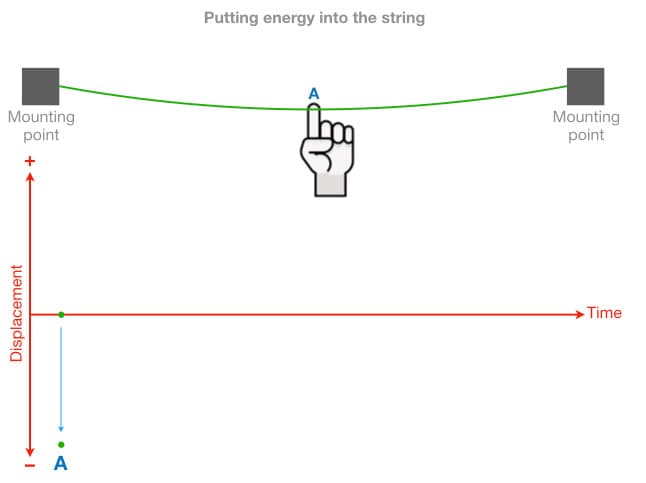
The illustration above shows the string being pulled down to a point of maximum downwards displacement, which we’ll call point A. When the string is released it attempts to return to its state of rest (minimum displacement), but it contains too much energy to stop there and must continue moving upwards. The illustration below shows the string passing through its state of rest but heading upwards. We’ll call that point B.
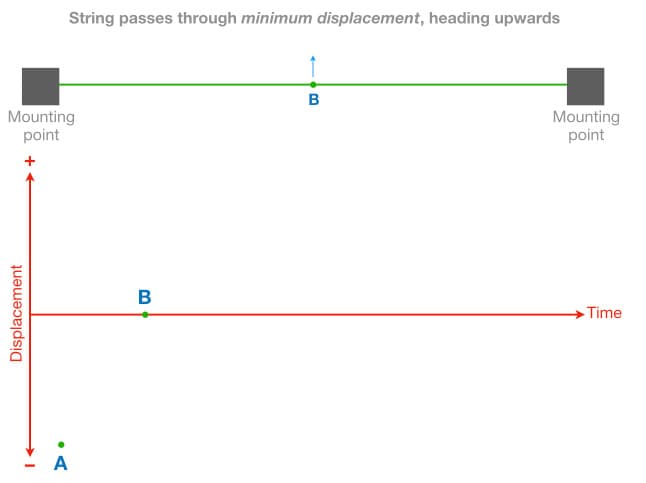
The next illustration shows that the string has continued moving upwards until it has reached the point of maximum upwards displacement, which we’ll call point C.
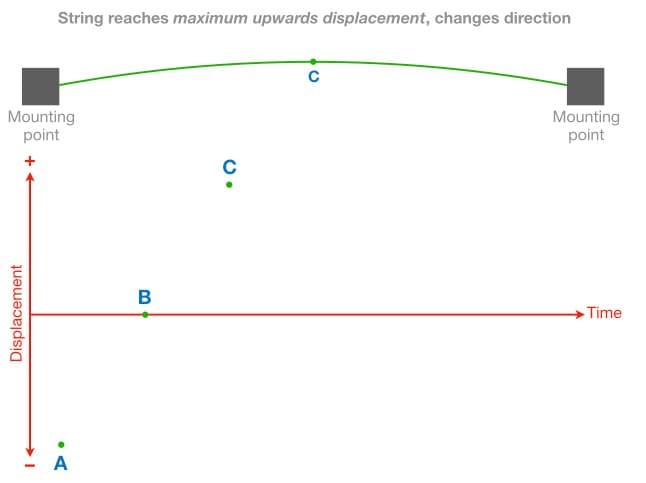
From the point of maximum upwards displacement the string changes direction and attempts to return to its state of rest again, but it still contains too much energy to stop there. We’ll call this point D; the string is passing through its state of rest but is heading downwards, as shown below.
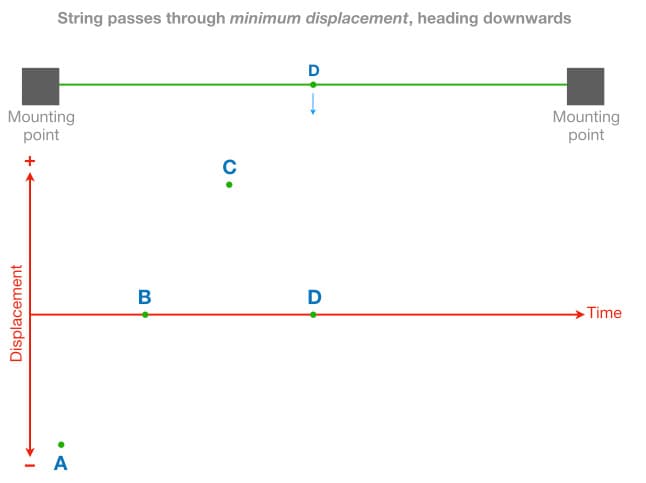
Eventually the string reaches the point of maximum downwards displacement, which we’ll call point E.
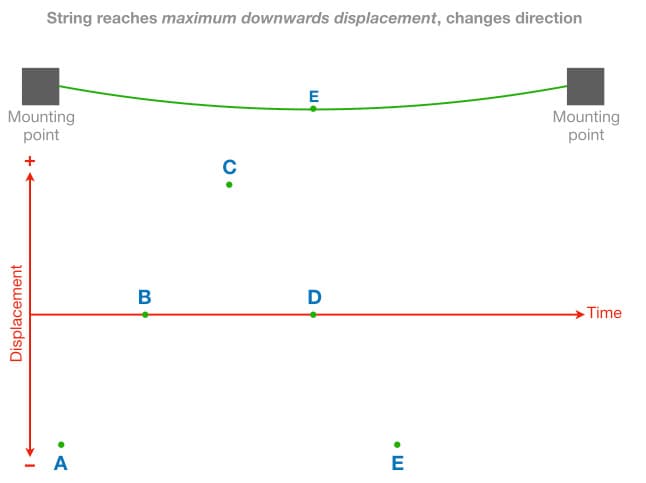
From here the string once again changes direction and attempts to return to its state of rest (point F) but it still contains too much energy and must continue upwards, moving towards point G (maximum upwards displacement) as shown earlier.
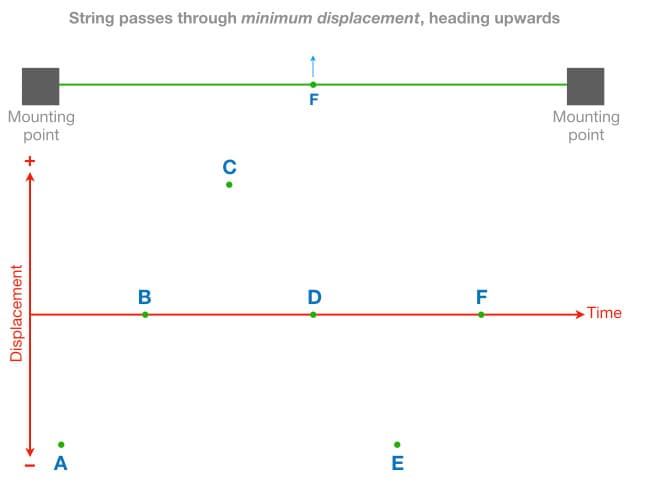
Eventually the string reaches the point of maximum upwards displacement again, and the cycle repeats itself.
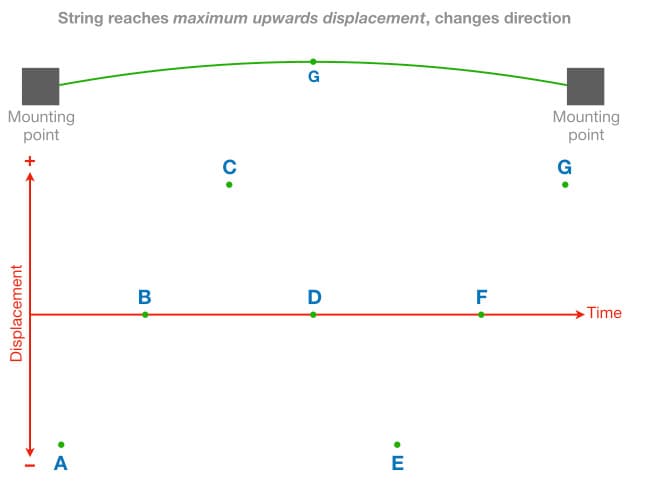
As we can see from points E to G, the process repeats itself but with every repetition a small amount of the energy is dissipated, so each point of maximum displacement is slightly less than the previous one. If we were to plot points A to G on a graph of displacement versus time and join the dots we’d expect it to reveal how the centre of the string moves over time. Based on the points we’ve identified so far, it would look something like this:
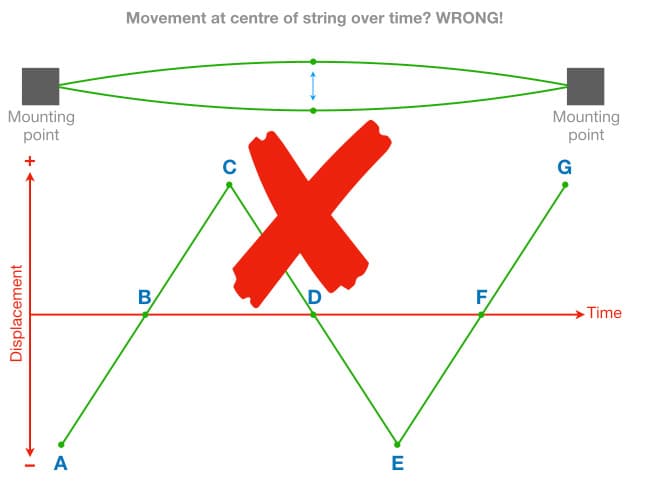
Although the graph shown above seems to make sense, it’s incorrect because it is not based on enough information – it only uses the points of maximum and minimum displacement. If we took many more measurements of the string’s displacement at regular time intervals throughout the vibration, rather than just the points of maximum and minimum displacement, the resulting graph would look like this:
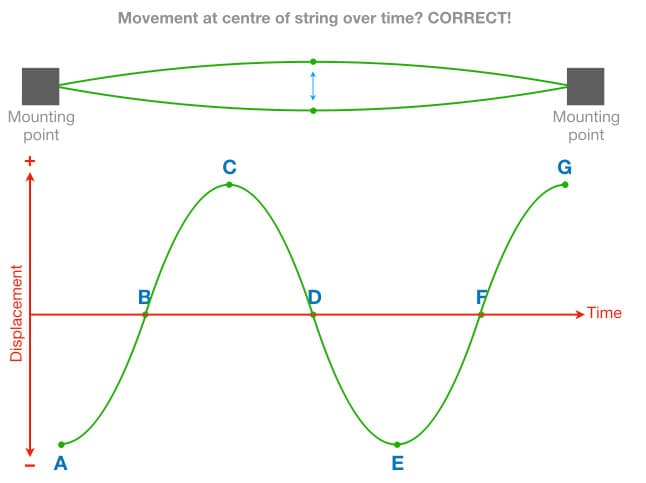
Let’s simplify this graph to a single cycle of vibration that starts from the state of rest (point B), moves to maximum upwards displacement (point C), changes direction, passes through the state of rest (point D), moves to maximum downwards displacement (point E), changes direction again, and returns to the state of rest (point F).
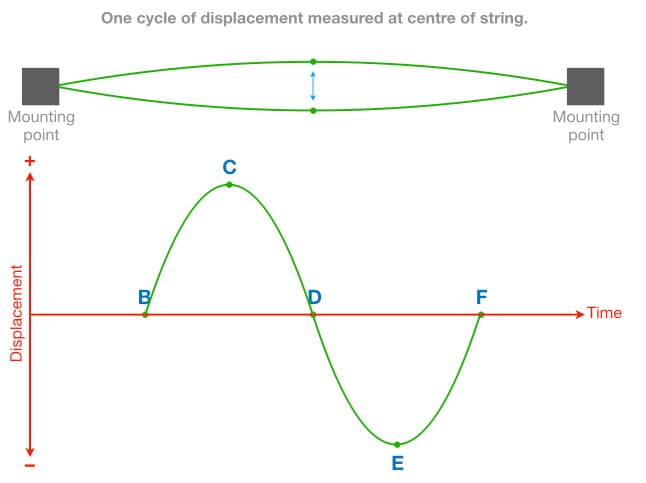
We have now isolated a single cycle of vibration and can see that the movement at the centre of the string creates the classic sinusoidal shape, in other words, a sine wave. That doesn’t mean that a vibrating string sounds like a sine wave (it doesn’t), it just shows us that the movement at the centre of the vibrating string follows a sinusoidal shape. The vibrating string on a musical instrument will do many of these cycles of vibration per second, each one taking the same amount of time but each one with slightly less displacement than the previous one as the energy gets dissipated. The amount of displacement ultimately determines the perceived loudness of the sound and the amplitude of the captured audio signal. So as the displacement reduces, so too does the perceived loudness of the sound and the amplitude of the signal captured by a microphone or pickup. As the energy is dissipated, the note fades out to silence and the string returns to its state of rest.
FREQUENCY
In statistics, the term frequency is used to describe how often something happens within a given amount of time. In audio we use frequency to describe how many cycles of vibration happen in one second. Therefore, frequency means ‘cycles per second’. In old-school audio terminology frequency was often measured as cps, for ‘cycles per second’, and you might still see cps on some vintage audio gear. In contemporary audio terminology cps has been replaced with Hertz, named after the German physicist Heinrich Hertz. It’s abbreviated to Hz, so 100Hz = 100 Hertz = 100cps = 100 cycles per second.
The frequency range of human hearing is said to extend from 20Hz to 20kHz; in other words, from 20 cycles of vibration per second to 20,000 cycles of vibration per second. That’s a huge range – the highest frequency we can hear vibrates 1000 times faster than the lowest frequency we can hear.
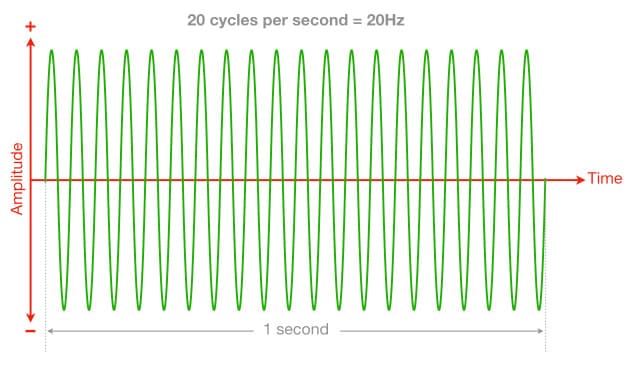
The tuning reference for Western music is A440. It is the A above Middle C on the piano keyboard (A4) and has a frequency of 440Hz, hence ‘A440’. If you play the A440 note on a piano, the appropriate strings will be doing 440 cycles of vibration per second – assuming the piano is in tune. If all of the musicians in an ensemble tune their instruments to the same reference note/frequency of A440, they should all be in tune with each other. As a matter of musical perspective, Middle C (C4) has a frequency of 261.6Hz…
PERIOD
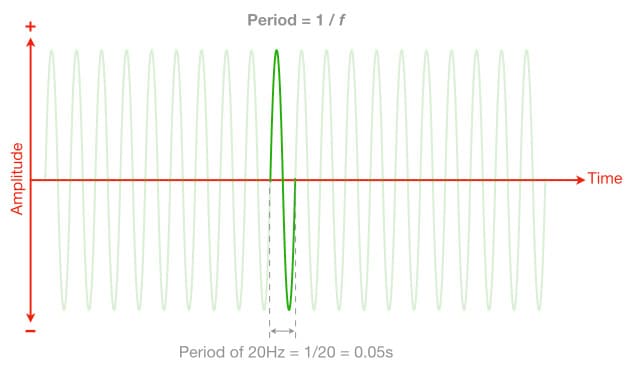
The frequency tells us how many cycles of vibration occur in one second, which allows us to determine how long it takes to complete one cycle of vibration. This is known as the period. It is measured in seconds and represented by a lower case t (for time). We can calculate the period with the following formula:
t = 1 / f
Where t = period in seconds, and f = frequency in Hertz. The ‘1’ represents one second, so we can see that the formula is simply turning the frequency into a fraction of one second. For example, a frequency of 440Hz has 440 cycles per second and each of those cycles has a period of 1/440th of a second.
At 20Hz, the lower limit of human hearing, the period is:
t = 1 / f = 1/20 = 0.05s
At 20kHz, the upper limit of human hearing, the period is:
t = 1 / f = 1/20,000 = 0.00005s
At A440, the tuning reference for Western music, the period is:
t = 1 / f = 1/440 = 0.00227s
At Middle C the period is:
t = 1 / f = 1/261.6 = 0.0038s
At 1kHz, the standard frequency used for many audio specifications, the period is:
t = 1 / f = 1/1000 = 0.001s
WAVELENGTH
The frequency tells us how many cycles occur in one second, and the period tells us the time taken to complete one cycle. These are both important concepts for understanding comb filtering, but there are three more concepts we need to understand before we can understand comb filtering. One of those is wavelength, which tells us the length of one cycle of vibration (i.e. a wave) as it travels through the air. To understand wavelength we need to know how fast sound travels through the air. This is generally known as the speed of sound, but it’s more correctly termed the velocity of sound propagation and is measured in metres per second (m/s).
In his book Room Acoustics, Heinrich Kuttruff defines the velocity of sound propagation as follows:
v = 331.4 + (0.6 x T) m/s
Where v = velocity in metres per second (m/s), and the upper case T = temperature in degrees Celsius (°C)
We can see from the formula that the velocity of sound propagation is dependent on temperature – in fact, temperature is the only variable in the formula. How significant is it? Let’s find out by calculating the velocity at two different temperatures. We’ll start with 0°C:
v = 331.4 + (0.6 x 0) = 331.4 + 0 = 331.4m/s
What about at 40°C?
v = 331.4 + (0.6 x 40) = 331.4 + 24 = 355.4m/s
So a 40° increase in the temperature, from 0°C to 40°C, creates a 24m/s increase in the velocity (from 331.4 to 355.4 m/s). That’s quite significant. As the formula shows us, every increase of 1°C in temperature results in a 0.6m/s increase in the velocity of sound propagation.
For most audio calculations we assume a room temperature of 20°C, which gives us a velocity of:
v = 331.4 + (0.6 x 20) = 331.4 + 12 = 343.4m/s
For the purposes of this discussion we’re going to ‘turn up the heat’ (so to speak) up by just one degree to 21°C, increasing the velocity by 0.6m/s to give us a more convenient velocity value of 344m/s, as shown below:
v = 331.4 + (0.6 x 21) = 331.4 + 12.6 = 344m/s
We’ll use that conveniently simplified velocity value of 344m/s throughout the rest of this discussion about comb filtering…
Calculating Wavelength
The velocity tells us how far the sound has travelled through the air in one second, and the frequency tells us how many cycles of vibration occurred in the air during that second. Knowing these figures allows us to calculate the length of one cycle as it passes through the air. This is known as the wavelength. It is represented by the Greek symbol λ (lambda) and is calculated with the following formula:
λ = v / f
Where λ is wavelength in metres (m), v is velocity in metres per second (m/s), and f is frequency in Hertz (Hz).
Let’s calculate the wavelengths at the lower and upper limits of human hearing, starting with 20Hz…
λ = v / f = 344/20 = 17.2m
Imagine that you are one cycle of 20Hz. You’re a massive 17.2m long, you’re racing through the air at 344m/s (i.e. the speed of sound, how exhilarating!), and there are 20 of you joined end-to-end every second. You’re not going to be stopped by a pane of glass, some heavy drapes, or a sheet of open cell foam glued to a plasterboard wall. You’re going to pass through all of those things without hesitation because, when you’re 17.2m long and hurtling through the air at 344m/s, those ‘obstacles’ simply don’t matter. Containing and controlling low frequencies within a room is difficult – that’s why we have acousticians.
What happens at 20kHz?
λ = v / f = 344/20,000 = 17.2mm
Now imagine that you are one cycle of 20kHz. You’re still racing through the air at 344m/s, of course, but now there are 20,000 of you joined end-to-end every second and each of you is a tiny 17.2mm long. If you’re lucky you might make it to the other side of the room without being absorbed by the air. A pane of glass or a simple plasterboard wall is a serious obstacle that you’re going to bounce off, just like a light beam reflecting off a mirror. If the surface has a rough textured finish you’re going to get scattered in numerous directions, similar to a light beam reflecting off a mirrorball at a dance party. If you encounter a sheet of open cell foam, some heavy drapes, a carpeted floor, some cushioned furniture, a fleece hoodie or some band members sporting respectable ‘fros, you’re going to be absorbed into non-existence and so are thousands of other cycles behind you. All of those absorptive obstacles spell ‘Game Over’ for 20kHz. Sustaining and distributing high frequencies within a room is difficult – that is also why we have acousticians.
Although we cannot see or touch sound, the concepts of frequency, period, velocity and wavelength help to give it dimension and make it more tangible.
PHASE & POLARITY
The concepts of phase and polarity are often confused. It’s a problem that’s been exacerbated for decades by manufacturers who continue to label a certain switch as ‘phase reverse’ or similar phase-related terms despite the fact that what it actually does is invert the polarity – which is a very different thing that has nothing to do with phase and, not surprisingly, creates a very different end result. They know it inverts the polarity because they designed it to do that, but they continue to label it as ‘phase reverse’, ‘phase invert’ or similar phase-related names that imply a form of time travel or similar magic, as we’ll see shortly. This confusion between phase and polarity is one of the reasons why people have a hard time comprehending comb filtering. Let’s get to the bottom of it…
Combining Signals
Altering an individual signal’s phase or polarity rarely has much of an audible impact on the individual signal itself, and it’s not until we combine it with other versions of itself that we notice a problem.
Whenever we combine two signals, the amplitude of the resulting signal at any point in time is simply the mathematical addition of the amplitudes of the two signals at that point in time. The illustration below shows two sine waves of the same frequency being combined together. In this example both sine waves have the same values at the same time, and the resulting signal is the addition of them. Because both signals have the same amplitudes at the same time the resulting signal will have twice the amplitude of the individual signals.
Containing and controlling low frequencies within a room is difficult – that’s why we have acousticians.
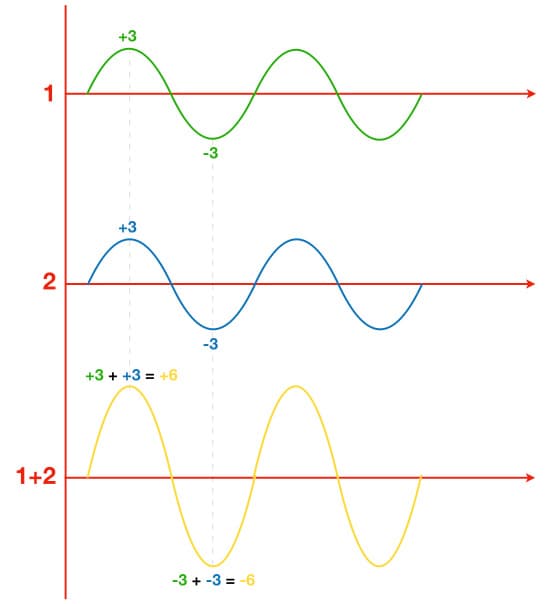
The following illustration shows the same two signals, but now one of them is negative when the other is positive, and vice versa. Because they have opposite amplitudes at any point in time, when added together they will cancel each other out.
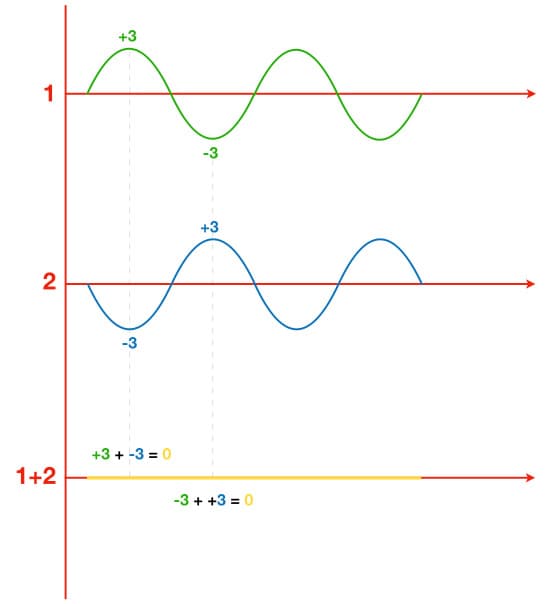
The illustration below shows the same two signals as the illustration above, but now the blue signal has less amplitude than the green signal and the resulting waveform is the difference between them. The green signal reaches a positive peak of +3 at the same time that the blue signal reaches a negative peak of -1. The result is the addition of the two: +3 + -1 = +2
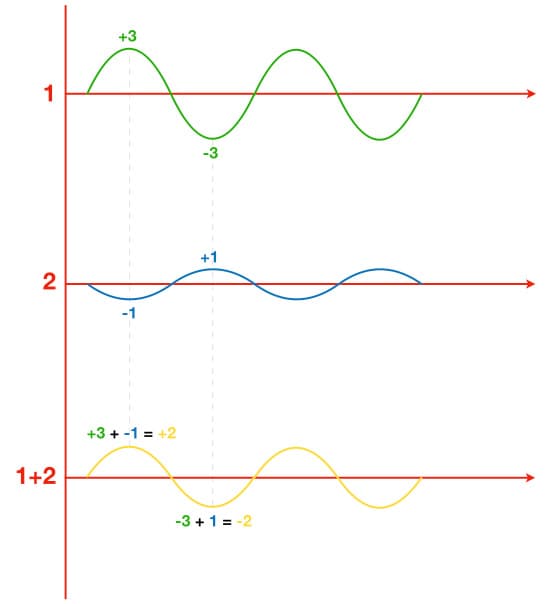
In both of the previous two illustrations it would be tempting to jump the gun and say that the blue signal is 180° out-of-phase with the green signal, but it could be simply inverted polarity – which creates a very different result in real-world audio situations. They are both simple and symmetrical waveforms, and because we cannot see the start or end of each signal in these illustrations (they are just excerpts from a signal for the purposes of these three illustrations) we cannot tell if the difference between them is due to phase or polarity. That’s what we’re going to look at next, because it’s a very important distinction…
What Is Polarity?
When it comes to audio signals, the term polarity refers to whether a point on the cycle is positive or negative relative to the reference (which is considered to be zero). The illustration below shows one complete cycle of a sine wave.
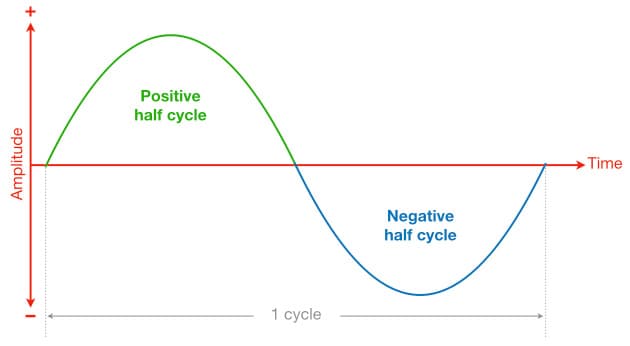
Note that the first half of the cycle (green) is positive, and is therefore known as the positive half cycle. The second half of the cycle (blue) is negative, and is therefore known as the negative half cycle. At any point within the positive half cycle the polarity is considered positive, while at any point in the negative half cycle the polarity is considered negative.
In the interests of being technically precise we have to introduce the term magnitude, which is the same as amplitude but without a polarity value. So a signal with an amplitude of +3 would have a magnitude of 3, and a signal with an amplitude of -3 would also have a magnitude of 3. For the purposes of this discussion, we can consider magnitude to be the same as amplitude but without any indication of the signal’s polarity. The magnitude is simply the numerical value of the amplitude, without the + or – sign.
When we invert the polarity of a signal we simply flip it upside down so that the positive half cycle becomes negative and the negative half cycle becomes positive. If we combine a signal with a polarity inverted version of itself (i.e. the same magnitude but with inverted polarity) the result will be complete cancellation.
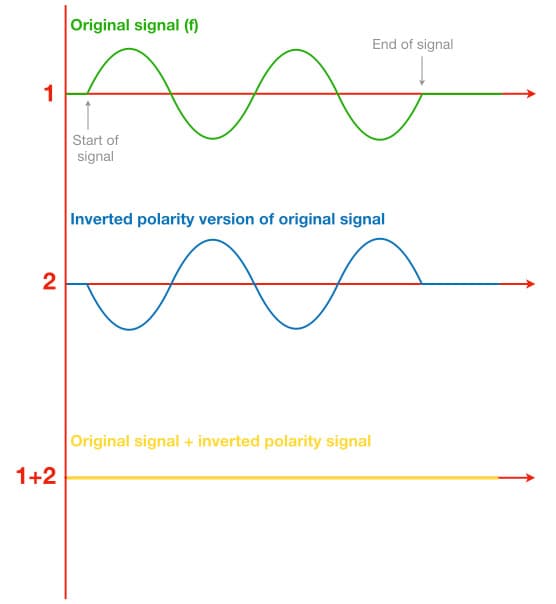
The illustration above shows a signal consisting of two cycles of a sine wave (green), that is being combined with an inverted polarity version of itself (blue). We can see that both waveforms begin and end at the same time, as indicated by the flat lines showing the start and end of the signal. The resulting signal (yellow) shows that total cancellation has occurred because both signals have the same magnitude but one signal has inverted polarity.
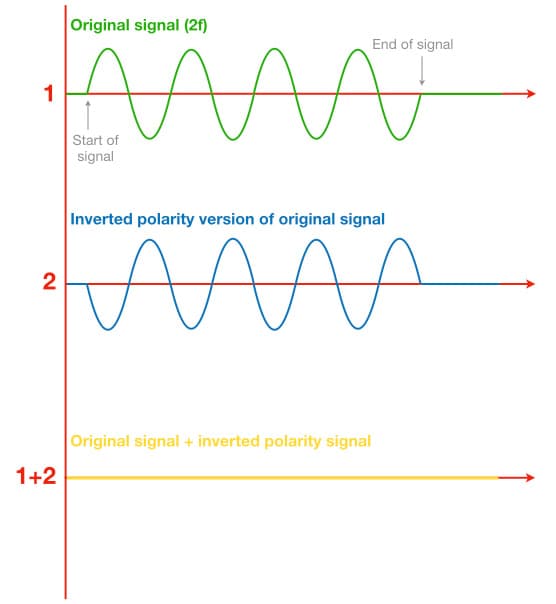
The illustration below shows a signal consisting of four cycles of a sine wave (green) over the same time duration as the earlier example. It completes twice as many cycles as the previous example, therefore it has twice the frequency. In musical terms, it is an octave higher. It is being combined with an inverted polarity version of itself and, again, the resulting signal (yellow) indicates that adding the two signals together results in total cancellation.
At first glance some readers will say that the inverted polarity signals (blue) in the two illustrations above are “180° out-of-phase” with the original signals (green). Bzzzt! Incorrect…
This reveals the long-held confusion between polarity (amplitude) and phase (time). In both of the above illustrations the blue signals are not out-of-phase with the green signals. In fact, they are perfectly in phase – we can see both signals start and end at the same time, they both reach maximum magnitudes at the same time, and they both cross the zero points at the same time. The blue signals are simply inverted polarity versions of the green signals, and that’s the only difference between them. As shown here, when any signal is combined with an inverted polarity version of itself at the same magnitude the result will be total cancellation – regardless of frequency. That’s not what happens when signals are out of phase, as we’re about to see…
What Is Phase?
There are 360° in a cycle, just like in a circle, and when vibrations are occurring with periodic motion we can consider one cycle of those vibrations to be similar to following the outline of a circle: it starts at a certain point and goes through an entire cycle before returning back to where it started.
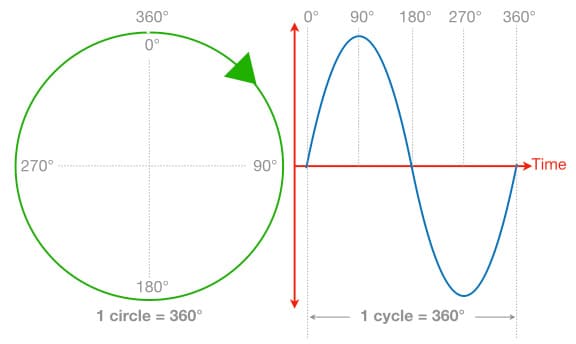
The term phase is used to describe a point within a cycle, and is expressed in degrees to give us a phase angle that we can use to represent that point within the cycle. For example, 0° is the start of a cycle, 90° is one quarter of the way through a cycle, 180° is halfway through a cycle, 270° is three quarters of the way through a cycle, and 360° is the end of a cycle. In the case of periodic motion, 360° is also 0° – the start of a new cycle.
The illustration below shows a number of sine waves, all of the same frequency but starting at different phase angles relative to the first sine wave, and therefore all having different phase relationships with it and with each other.
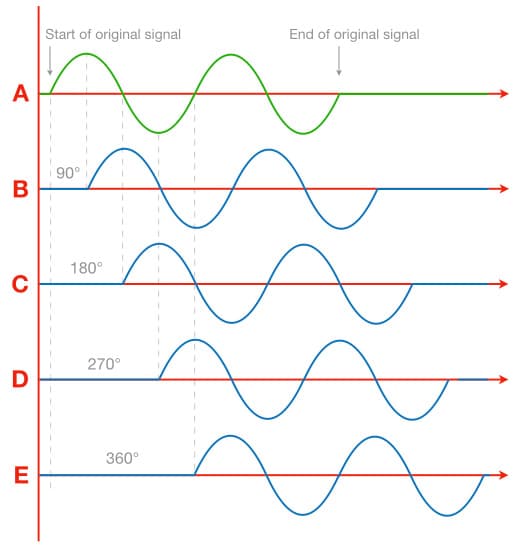
The second sine wave (B) is 90° behind the first one (A), and its phase relationship with the first one can be correctly described as being “90° out-of-phase”. It could also be said that the second sine wave is lagging the first sine wave by 90°, or that the first sine wave is leading the second one by 90°. Similarly, the third sine wave (C) is 180° behind (or “out-of-phase” with) the first sine wave (A), the fourth sine wave (D) is 270° behind the first sine wave (A), and the fifth sine wave (E) is 360° behind the first sine wave. Note that they are all versions of the same signal but with different start times due to each one being delayed, or phase-shifted, 90° behind the previous one.
The two illustrations below show the same two sine waves used in the earlier illustrations to demonstrate inverted polarity, but this time they’re being combined with delayed or phase-shifted versions of themselves instead of inverted polarity version of themselves. The delay time is the same for both examples.
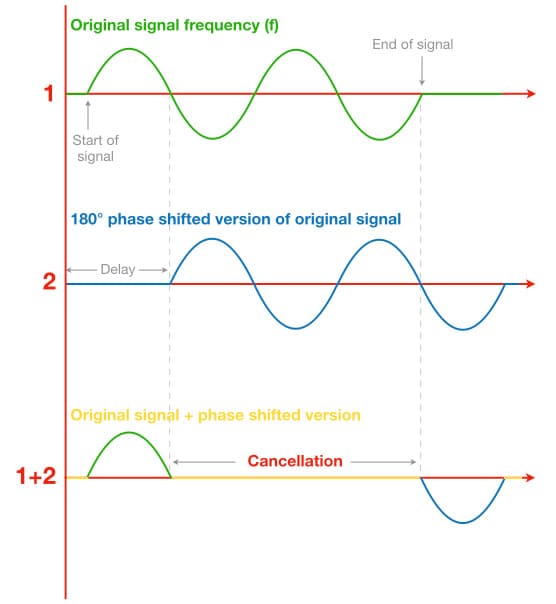
The sine wave (green) in the illustration above completes two cycles of vibration. The delayed signal (blue) also completes two cycles but it has been delayed so that it starts half a cycle after the green signal. In other words, the delay puts it 180° out-of-phase with the green signal. Both signals have the same magnitude, and we can see that adding them together results in total cancellation – except for the first half cycle of the green signal and the last half cycle of the blue signal, where only one signal exists and therefore no cancellation. The cancellation occurs because the original signal (green) is in its negative half cycle when the delayed signal (blue) is in its positive half cycle, and vice versa. The delayed signal looks like its polarity has been inverted, but it has not. It simply begins half a cycle after the first signal – putting the delayed signal 180° behind, or 180° out-of-phase with, the original signal. It is correct to say that the two signals are “180° out-of-phase”. The resulting cancellation would cause a dip in the frequency response at the frequency that is 180° out-of-phase. If both signals have the same magnitude, the cancellation will reach a complete null. (It’s important to note that for any given delay time, only one frequency will actually be 180° out of phase – more about that later…)
So far so good, but things get interesting in the illustration below. Here we see a sine wave (green) with twice the frequency of the previous example. The blue signal has been delayed by the same time duration used in the previous illustration. However, because the original signal is twice the frequency of the previous illustration, the delayed signal (blue) is now 360° behind the original signal. In other words, it has been delayed by one full cycle. Because the sine wave is a symmetrical waveform it looks as though the two signals are in phase and it is therefore tempting to say that they are “back in phase” when, in fact, they’re 360° out-of-phase – the delayed signal begins one full cycle after the original signal.
Because the delay is equal to the duration of one full cycle at this frequency, the original signal (green) and the delayed signal (blue) both have positive polarities at the same time, and both have negative polarities at the same time. Therefore, adding them together results in addition, otherwise known as reinforcement – which causes a peak in the frequency response at this frequency. If both signals have the same magnitude and polarity, adding them together will result in a 6dB increase in amplitude.
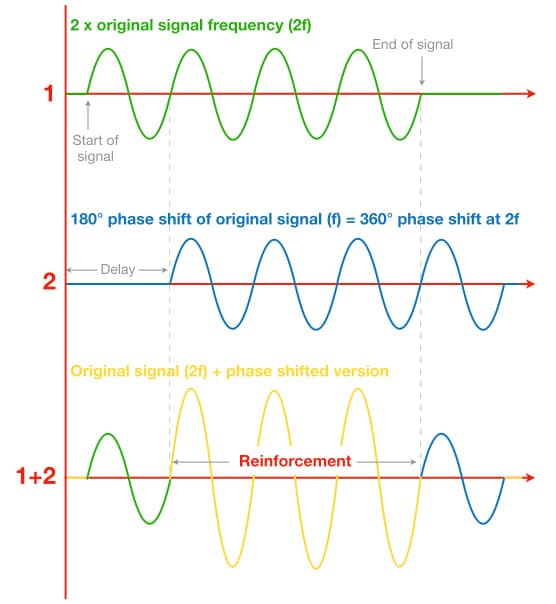
The two illustrations above show the effect of delaying the signal, i.e. shifting the phase. Both signals have the same delay, which is equal to half a cycle of the first sine wave (i.e. half the period or half the wavelength) but is equal to a full cycle of the second sine wave (i.e. one full period or one full wavelength). This delay causes a cancellation null in the first illustration but a +6dB reinforcement in the second illustration. As we will see in the next instalment of this series, that simple delay causes cancellations at all odd-numbered multiples of the first frequency to cancel, and reinforcements (up +6dB) at all even numbered-multiples of it – resulting in a series of peaks and dips throughout the frequency response that is otherwise known as comb filtering. It is very different to the complete cancellation caused by inverted polarity.
Phase Invert & Other Nonsense
As we have just seen, phase is ultimately an indicator of time. It is a relative measurement of the elapsed time within a cycle, given in degrees and referenced to a starting point of 0°. With this in mind we can see that the term ‘phase invert’ means ‘turn time upside down’, which is nonsense. Similarly, the term ‘phase reverse’ implies ‘making time go backwards’, which is also nonsense – at least when it’s offered as a function on a microphone preamplifier.
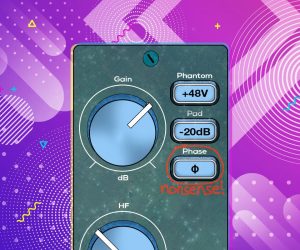
The switch on a microphone preamplifier that is often called ‘Phase Reverse’, ‘Phase Invert’, ‘Phase’ or is indicated by the Greek letter φ (Phi, which is used to indicate ‘phase’ in maths and science) is actually inverting the signal’s polarity and should be called ‘Polarity Invert’, ‘Polarity’ or simply ‘Invert’. We’ll come back to that incorrectly named switch in the next instalments when we dive deeper into comb filtering. All we need to know for now is that pressing that switch doesn’t prevent or fix comb filtering, it just makes it sound different by inverting the polarity of the offending signal – thereby turning all of the comb filtering peaks into dips, and all of the comb filtering dips into peaks. It’s up to us to choose whichever of the two versions we find less offensive, or, better yet, take whatever action is necessary to prevent the comb filtering from happening in the first place.
If you have finally understood the distinction between phase and polarity due to reading this, hold your hand at arms length and bring the tips of your thumb and forefinger towards each other until there is a 1mm gap between them. Congratulations, you are now that much smarter than you were before because you have finally grasped a ridiculously simple concept suitable for ages 10 and over: phase exists on the time axis, and polarity exists on the amplitude axis. Inverting a signal’s polarity and asking how much it has put the signal out-of-phase is like someone asking “How tall are you?” and answering with “6 o’clock”. It’s nonsense. The next time you hear someone say they’re going to “flip the phase” or similar ‘baffle you with science’ nonsense, rejoice in the knowledge that you are 1mm smarter than they are. You cannot ‘flip phase’ any more than you can ‘shift polarity’ (or measure knowledge in millimetres, for that matter). However, you can ‘flip the polarity’ because polarity exists in the amplitude domain and can be either positive or negative, and you can ‘shift the phase’ because phase exists in the time domain – in fact, every time you slide a signal along the horizontal axis in your DAW you are moving it through time and therefore affecting its phase relationship with other signals, aka ‘shifting the phase’. That is exactly what engineers do when time-aligning close mics and distant mics that are capturing the same signal, or when calibrating delay speakers in a PA system…
INVERTED POLARITY OR PHASE SHIFTING?
An inverted polarity signal is perfectly in phase with the original signal – there is no time delay between the two signals and therefore there can be no phase difference. They start and end at the same times, they both reach maximum magnitudes at the same time, and they both pass through zero at the same times. The only difference between them is that the signal’s polarity has been inverted, turning it into a mirror image of the original signal – when one signal has a positive polarity the other has a negative polarity, and vice versa. Adding them together will cause a cancellation that affects all frequencies equally. If both signals have the same magnitude but one has inverted polarity, total cancellation will occur. Adding a signal to an inverted polarity version of itself does not cause comb-filtering, it just affects the overall amplitude of the signal.
A phase-shifted signal is a delayed version of the original signal. Its polarity has not been inverted, but, due to the delay, there will be some frequencies where the delayed signal has the opposite polarity to the original signal and other frequencies where it has the same polarity. Adding the original signal and the delayed signal together will cause cancellations (dips in the frequency response) at the frequencies that have the opposite polarity, and reinforcements (peaks in the frequency response) at the frequencies that have the same polarity. That is what causes comb-filtering.
Adding a signal to an inverted polarity version of itself does not cause comb-filtering, it just affects the overall amplitude of the signal.
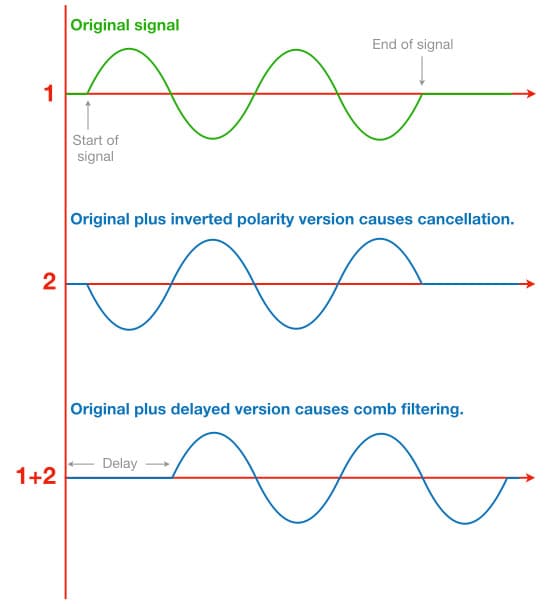
The switch on your preamplifier that is incorrectly labelled ‘Phase Reverse’ (or similar nonsense) is not doing anything to the signal’s phase, it is simply inverting the polarity. It is an amplitude-based solution to an amplitude-based problem. We’ll look at that amplitude-based problem, and comb filtering, in more detail in the next instalment. In the meantime, remember that using an amplitude-based solution (inverting the polarity) to fix a time-based problem (comb filtering) is like using SCUBA gear to go skydiving. You’re diving, but you’re using the wrong tools. Hang on to your SCUBA gear, however, because we’re about to dive even deeper…






RESPONSES